Easily monitoring power usage with Grafana
Update October 2022
In the article I am using InfluxDB in version 1.*. The setup has recently been upgraded to version 2.*. If the setup should be used in this version then the following files should be used instead of the ones referenced in the article:
- docker-compose.yml (nur InfluxDB ohne Grafana)
- Grafana Dashboard with new Queries (Flux instead of InfluxQL)
- Script for data processing
I wanted to get a better look into the power usage of my devices. To do so I have set up a monitoring using Grafana and InfluxDB to get a detailed overview about the used power.
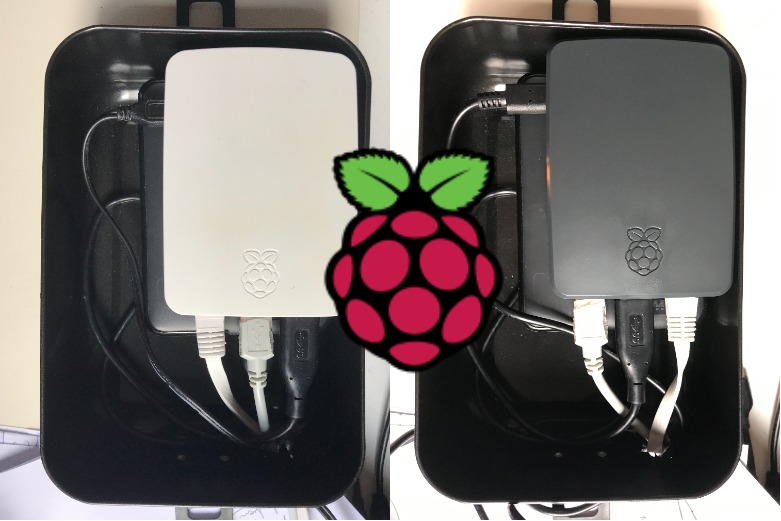
The primary components are a TP-Link HS110 Smart Plug, a Raspberry Pi and optionally a server which provides Grafana and InfluxDB and makes it available through the public internet. This is not needed if the applications should only be accessed locally or if you are able to access the mentioned Raspberry Pi from the public internet.
The Smart Plug was available at a nearby electronics market for 23€ and the other components were already in use by myself. This made it a very cheap project.
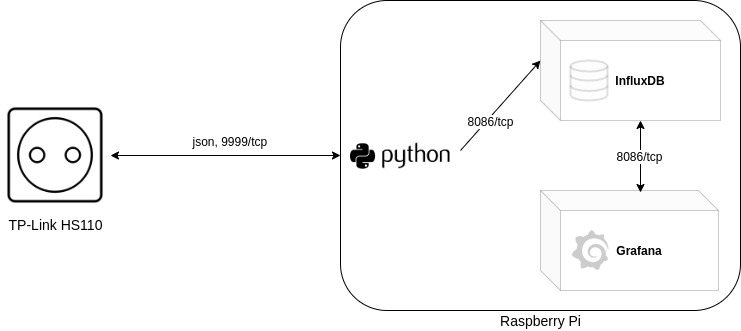
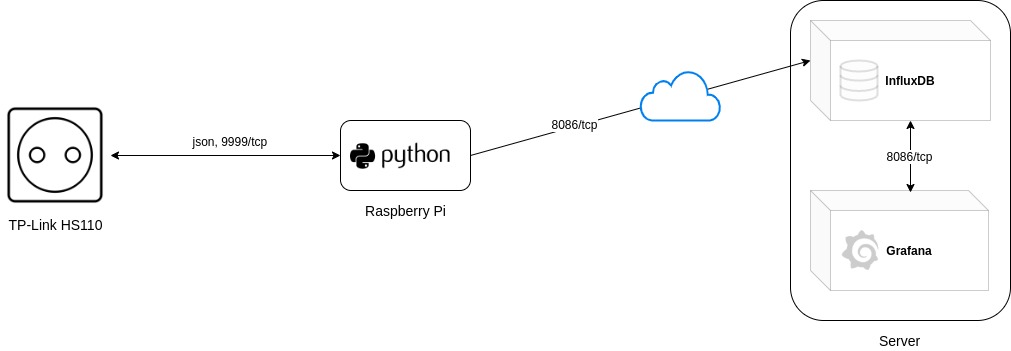
To give a more detailed overview of what the setup(s) look like:
Setup
Smart Plug
It all began with plugging the Smart Plug into a power outlet and setting it up using the app “Kasa”, which is available both on iOS and Android. During setup the plug will be connected to the wifi and will be assigned an IP address as usual.
InfluxDB and Grafana
Afterwards I have set up the applications InfluxDB and Grafana. InfluxDB is the database software which is used to store data. This data can then be accessed by Grafana to display it in a nice way. In my case I used docker-compose to run the applications (example of what my compose file looked like: docker-compose.yml).
Of course docker is not neccessary to run these applications. They can also be installed manually. If you do so, you also need to initialize a new database and create the needed database users. These steps are automatically done when running the applications with docker-compose and defining the required environment variables.
These applications can either run on the Raspberry Pi itself or on any other device. In my case a VPS which is accessible through the internet.
Data processing through Raspberry Pi
The next step was to set up the software on the Raspberry Pi. It will be used to query the data from the smart plug and write it into the Influx database. To achieve this I oriented myself on the article which is linked at the end of this one. In the mentioned article there was a Python script used which sends requests to the smart plug and writes the results into the database. Since the mentioned script was initially only able to write data to a Graphite database I had to modify it. On top of that TP-Link has made some changes on how data can be requested from the plug (as mentioned in this article at the end). Regarding these changes I also had to modify the script.
Please also note that for the script to work you need to have the package “influxdb” installed via pip.
pip3 install influxdb
After I have added my changes the script looked like this:
With the variables in the beginning the connection details to the database and the IP of the smart plug is defined.
Further on in the function “store_metrics” I defined how the data should be written to the database. There are two measurements being created. “PowerData” and “PowerUsage”. Measurements can be compared to the tables of conventional databases. Values like current, voltage and amperage are stored in “PowerData”.
Since the HS110 plug is by default able to store data of the overall used power, I am storing it in “PowerUsage”.
If both database and smart plug are reachable, you can give the script a test run. A successful run looks like this:

Since the execution of the script should happen automatically I created a systemd service which runs it in the background. Enabling it afterwards made sure it is started even after a reboot of the Pi.
nano /lib/systemd/system/hs110.service
[Unit]
Description=HS110 Service
After=syslog.target

[Service]
Type=simple
User=root
WorkingDirectory=/root/scripts/
ExecStart=/usr/bin/python3 /root/scripts/hs110-data-collect-influxdb.py
StandardOutput=syslog
StandardError=syslog

[Install]
WantedBy=multi-user.target
sudo systemctl enable hs110.service && sudo systemctl start hs110.service
With the previous steps I achieved that the data from the plug is queried and then written to the database. In the next steps I used Grafana to query the data from the database and present it on a dashboard.
Presentation
To query the data I had to configure a database connection in Grafana. This is done by selecting the option of adding a InfluxDB database in the section “Data Sources”. A connection test afterwards was successful.
With the queried data I started creating a new dashboard. To not make this article too big I created an export of my dashboard. This can be imported by anyone using Grafana. You need to note that the JSON file expects a Data Source called “Steckdose” and two measurements called “PowerData” and “PowerUsage”. Those values might need to get adjusted depending on your configuration.
Link to the JSON file: https://gist.github.com/bjarneeins/076b874ef1027892d3b0bfa1df633fc5
This is how the dashboard will look after importing it:
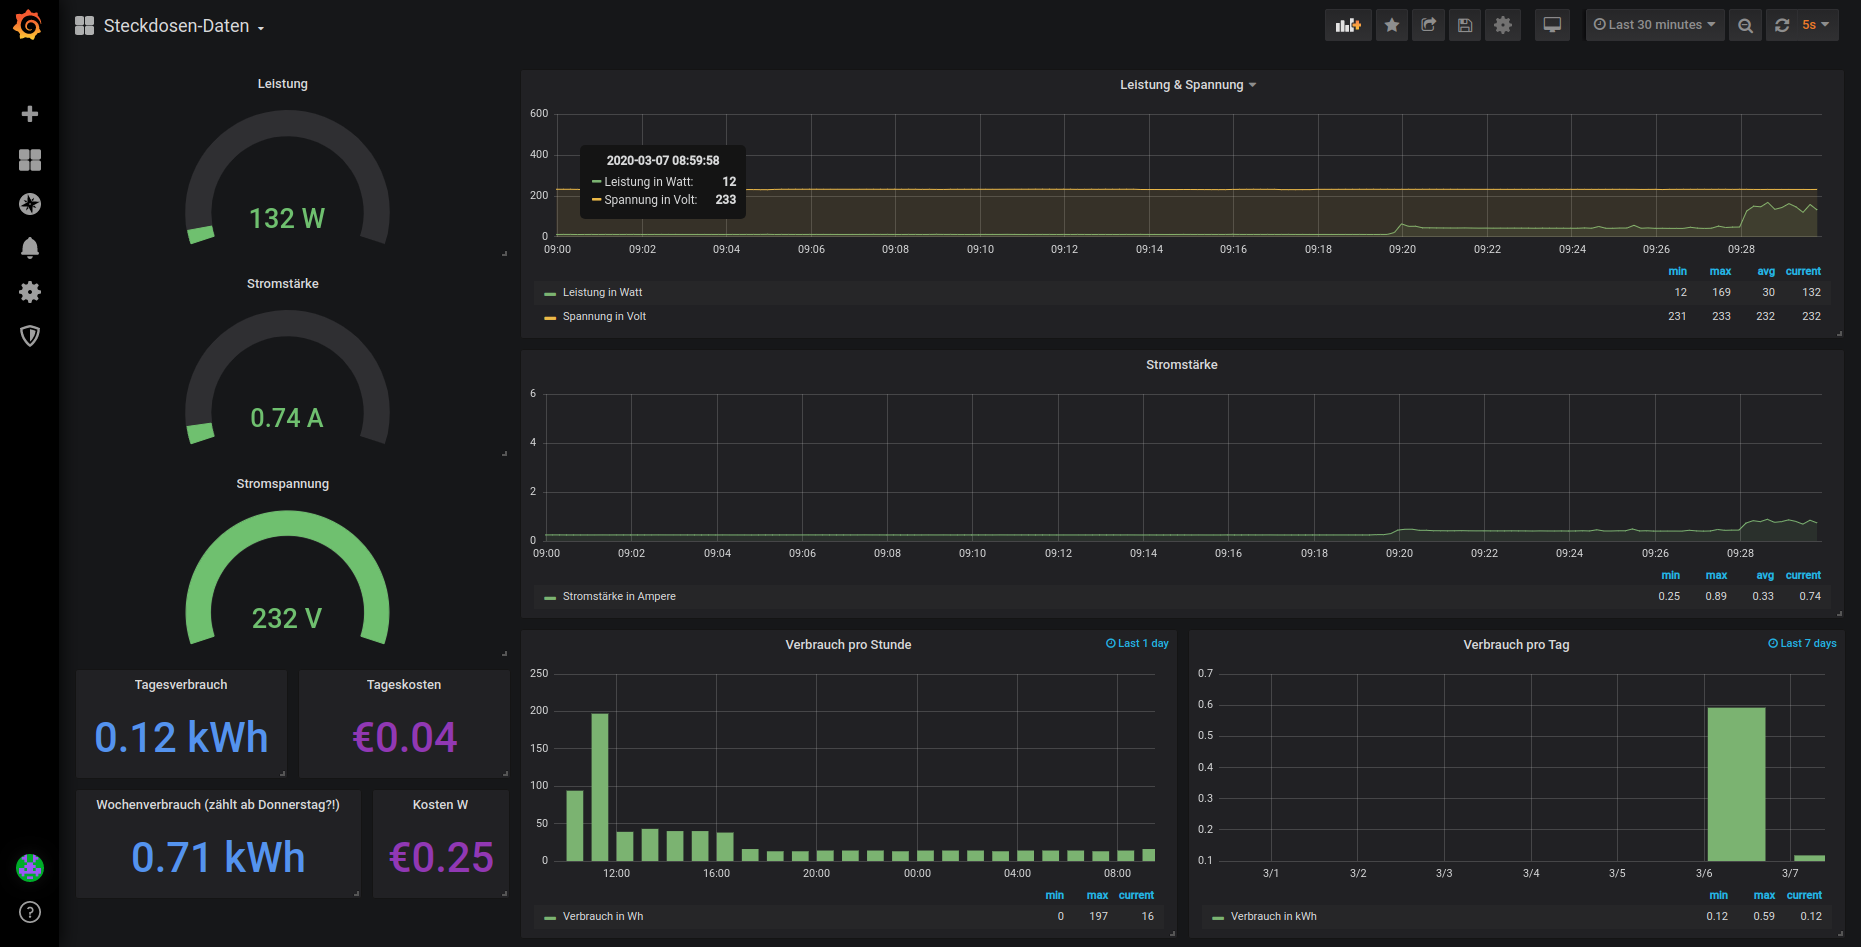
With this dashboard you are getting informations on:
- the currently drawn power in watts
- the current in amperage
- the existing voltage in volt
- the power usage in watt hours, divided into each hour
- the power usage in kilowatt hours, divided into days
- the paid price for the used power (per day)
- the paid price for the used power (per week)
When calculating the prices I am expecting a price of 0,35€ per kWh. It could obviously be more or less where you live.
Additional steps
To not let the database grow forever I set up a retention policy which deletes the data in 24 hour shards after they get older than 4 weeks. To implement this I executed the following commands:
influx -username 'admin' -password 'geheim' -execute 'CREATE RETENTION POLICY "four_weeks" ON "dosedata" DURATION 4w REPLICATION 1'
influx -username 'admin' -password 'geheim' -execute 'ALTER RETENTION POLICY "four_weeks" ON "dosedata" SHARD DURATION 1d DEFAULT'
Finish
Currently the setup can only query data from a single plug (which is enough in my case). I think it should not be too hard to adjust everything so several plugs can be queried. I might update this article in the future when I have done something similar.
I will try to adjust this article and also the scripts when I make adjustments in my personal setup. If you should have recommendations I am of course open to hear them.
I got inspiration for this article from: https://www.beardmonkey.eu/tplink/hs110/2017/11/21/collect-and-store-realtime-data-from-the-tp-link-hs110.html
In addition I got informations on how to query the data from the smart plug from this Github repository: https://github.com/softScheck/tplink-smartplug
Converting pictures in a Docker container using Guetzli
Updating dockerized Check_MK